1、首先引入echart.js
<script type="text/javascript" src="https://www.atool.online/article/{{ asset('/public/js/echarts.js') }}"></script>
2、html页面,要有一个布局容器,用来显示图像,一定要设置宽和高
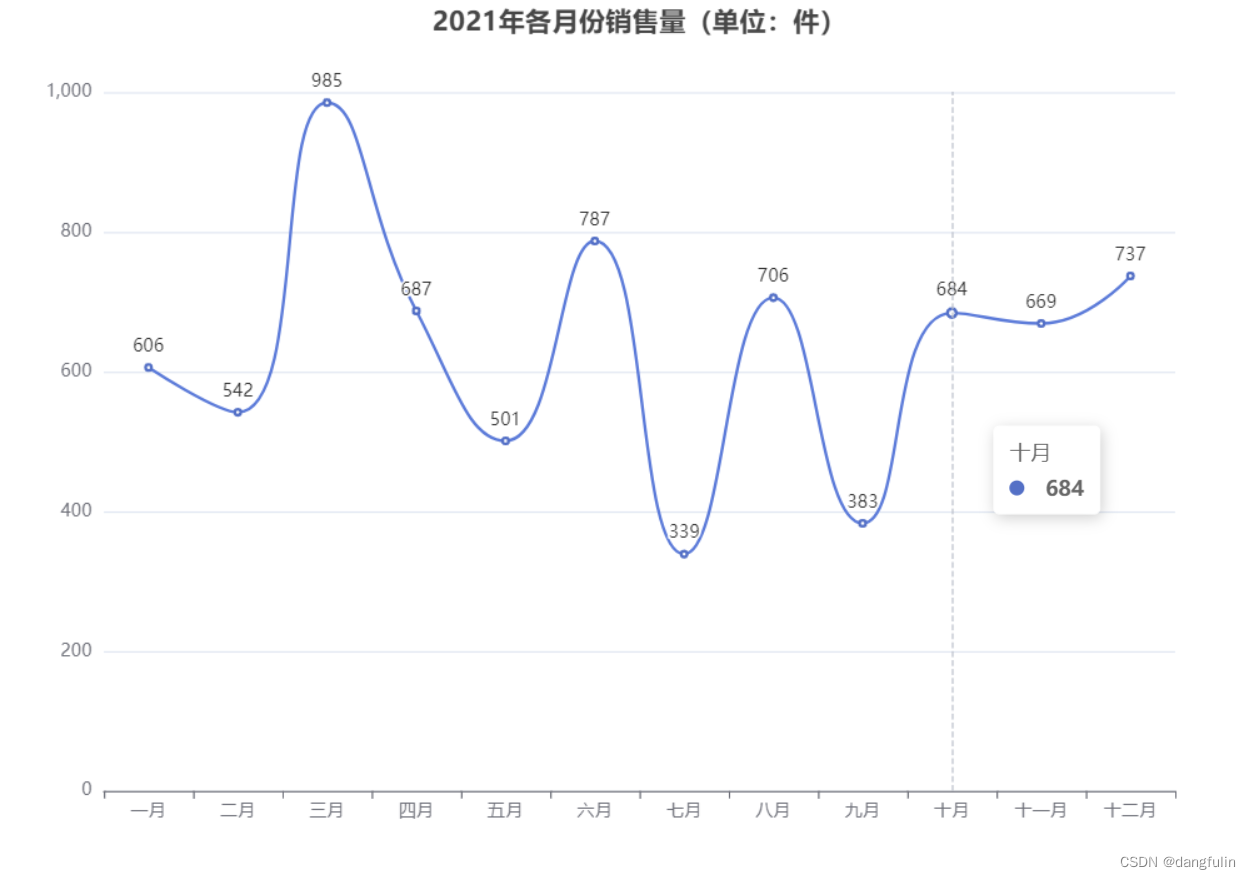
<div class="contain" style="width: 84%;" id="contain"></div>
3、echarts折线图的使用
var myChart = echarts.init(document.getElementById("contain"));

   option = {
    title : {
     text: '时间变化图' // 标题
    },
    tooltip : {
     trigger: 'axis' // 折线图
    },
    legend: {
     data:['时间'] // 图例,就是折线图上方的符号
    },
    toolbox: { // 工具箱,在折线图右上方的工具条,可以变成别的图像
     show : true,
     feature : {
      mark : {show: true},
      dataView : {show: true, readOnly: false},
      magicType : {show: true, type: ['line', 'bar']},
      restore : {show: true},
      saveAsImage : {show: true}
     }
    },
    calculable : true, // 是否启动拖拽重计算属性,默认false
    xAxis : [ // x坐标轴
     {
      axisLine: { // x坐标轴颜色
       lineStyle: { color: '#333' }
      },
      axisLabel: { // x轴的数据会旋转30度
       rotate: 30,
       interval: 0
      },
      type : 'category',
      boundaryGap : false, // x轴从0开始
      data : [] // x轴数据
     }
    ],
    yAxis : [ // y轴
     {
      type : 'value',
      axisLabel : {
       formatter: '{value} 秒' // y轴的值都加上秒的单位
      },
      axisLine: {
       lineStyle: { color: '#333' }
      }
     }
    ],
    series : [ // 设置图标数据用
     {
      name:'时间',
      type:'line',
      smooth: 0.3, // 线有弧度
      data: [] // y轴数据
     }
    ]
   };
   // 使用刚指定的配置项和数据显示图表。
   myChart.setOption(option);
4、实现功能
(1)路由
Route::get('/', 'UserController@index');
Route::post('/axis', 'UserController@axis');
(2)方法
public function index()
 {
  return view('user.index');
 }
// 是ajax所用的的方法,得到要显示的数据,返回数组
public function axis()
 {
  $key = Key::all('name', 'ttl', 'created_time');
  return $key;
 }
(3)当访问/首页时,到index.blade.php
(4)index.blade.php的内容
<div class="contain" style="width: 84%;" id="contain"></div>

 <script type="text/javascript">

  var names = []; // 设置两个变量用来存变量
  var ttls = [];
  var time = Date.parse(new Date()).toString().substr(0, 10); // 获取当前时间,精确到秒,但因为是毫秒级的,会多3个0,变成字符串后去掉
  time = parseInt(time);
  function getData()
  {
   $.post("{{ url('/axis') }}", {
    "_token": "{{ csrf_token() }}"
   }, function(data) {
    $.each(data, function(i, item) {
     names.push(item.name);
     if((ttl = (parseInt(item.ttl) + parseInt(item.created_time) - time)) > 0) { // 小于0就==0,
      ttls.push(ttl);
     } else {
      ttls.push(0);
     }
    });
   });
  }
  getData(); // 一定不能忘了,调用

  // 实现画图的功能
  function chart() {
   var myChart = echarts.init(document.getElementById("contain"));

   option = {
    title : {
     text: '键名过期时间变化图'
    },
    tooltip : {
     trigger: 'axis'
    },
    legend: {
     data:['过期剩余时间']
    },
    toolbox: {
     show : true,
     feature : {
      mark : {show: true},
      dataView : {show: true, readOnly: false},
      magicType : {show: true, type: ['line', 'bar']},
      restore : {show: true},
      saveAsImage : {show: true}
     }
    },
    calculable : true,
    xAxis : [
     {
      axisLine: {
       lineStyle: { color: '#333' }
      },
      axisLabel: {
       rotate: 30,
       interval: 0
      },
      type : 'category',
      boundaryGap : false,
      data : names // x的数据,为上个方法中得到的names
     }
    ],
    yAxis : [
     {
      type : 'value',
      axisLabel : {
       formatter: '{value} 秒'
      },
      axisLine: {
       lineStyle: { color: '#333' }
      }
     }
    ],
    series : [
     {
      name:'过期剩余时间',
      type:'line',
      smooth: 0.3,
      data: ttls // y轴的数据,由上个方法中得到的ttls
     }
    ]
   };
   // 使用刚指定的配置项和数据显示图表。
   myChart.setOption(option);
  }

  setTimeout('chart()', 1000); // 为什么加定时器?因为上面是一起执行的,可能还未取得数据,便已经将图画好了,图上就没有数据,所以这里我延迟了1s,

 </script>
(5)大功告成!!
以上这篇使用laravel和ECharts实现折线图效果的例子就是小编分享给大家的全部内容了,希望能给大家一个参考,也希望大家多多支持阿兔在线工具。


