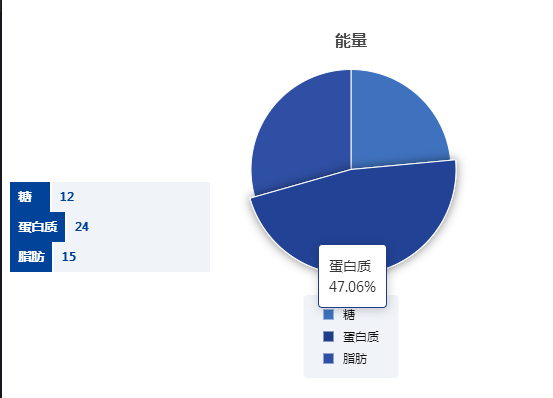
简单易懂的Echars案例,实现点击列表联动饼图
- 安装 echarts-for-react
- 项目中引入 import ReactECharts from 'echarts-for-react';
- 开始写案例啦!!!
效果图

1. 首先我们先写一个左侧列表 StageLine
利用StageItem 将 data 中的数据遍历并展示。
import React = require('react');
import { StageItem } from './StageItem';
const data = [
  { name: '糖', value: '12' },
  { name: '蛋白质', value: '24' },
  { name: '脂肪', value: '15' },
];
type StageLineProps = {
  handleClickPie?: (index: number) => void;
  setCurrentIndex?: (o: number) => void;
};
export default function StageLine({
  handleClickPie,
  setCurrentIndex,
}: StageLineProps) {
  return (
    <div>
      {data?.map((item, index) => {
        return (
          <div
            key={index}
            onClick={() => {
              handleClickPie?.(index);
              setCurrentIndex?.(index);
            }}
          >
            <StageItem title={item.name} value={item.value} />
          </div>
        );
      })}
    </div>
  );
}
StageLine 子组件 StageItem
import { Group, Text } from '@mantine/core';
import React = require('react');
type StageItemProps = { title: string; value: string };
export function StageItem({ title, value }: StageItemProps) {
  return (
    <Group
      spacing={2}
      noWrap
      align="center"
      sx={{
        cursor: 'pointer',
        width: 200,
        display: 'flex',
        flexDirection: 'row',
        flexWrap: 'nowrap',
        justifyContent: 'center',
        alignItems: 'stretch',
        alignContent: 'stretch',
        alignSelf: 'normal',
      }}
    >
      <Text
        sx={{
          backgroundColor: '#004399',
          padding: '6px 8px',
          color: 'white',
          minWidth: 40,
          maxWidth: 85,
          lineHeight: '18px',
          alignItems: 'stretch',
          display: 'inline-block',
          flexShrink: 0,
        }}
        size={12}
        weight={600}
      >
        {title}
      </Text>
      <Text
        sx={{
          backgroundColor: 'rgba(0, 67, 153, 0.06)',
          padding: '6px 8px',
          color: '#004399',
          flexGrow: 1,
          '.react-katex ': {
            // height: '26px',
          },
        }}
        size={12}
        weight={600}
      >
        {value ?? '-'}
        {/* <div style={{ display: 'inline-block' }}>{unit}</div> */}
      </Text>
    </Group>
  );
}
2.接下来我们写右侧饼图
我们利用 forwardRef 来接受从父组件传递过来的 ref,并将 ref 赋给饼图组件 ReactECharts。拿到饼图的ref 我么 就可以实现左右联动的效果啦!
import { EChartsInstance } from 'echarts-for-react';
import { log } from 'echarts/types/src/util/log';
import { forwardRef, lazy } from 'react';
import React = require('react');
const ReactECharts = lazy(() => import('echarts-for-react'));
const data = [
  { name: '糖', value: '12' },
  { name: '蛋白质', value: '24' },
  { name: '脂肪', value: '15' },
];
export const Pie = forwardRef<EChartsInstance, any>((_, ref) => {
  // console.log(ref,2)
  const options = {
    color: [
      '#3F72BE',
      '#1F3C88',
      '#2E4FA3',
      '#6B90D8',
      '#8DBEEB',
      '#B6D0F8',
      '#DAEBFB',
      '#F0F8FD',
    ],
    title: {
      text: '能量',
      left: 'center',
      textStyle: {
        fontSize: '16px',
        fontWeight: 700,
      },
    },
    tooltip: {
      trigger: 'item',
      formatter: `{b} <br/>{d}% `,
      showContent: true,
      alwaysShowContent: false,
      displayMode: 'single',
      renderMode: 'auto',
      confine: null,
      showDelay: 0,
      hideDelay: 100,
      transitionDuration: 0.4,
      enterable: true,
      textStyle: {
        fontSize: 14,
        color: '#333',
      },
    },
    legend: {
      itemStyle: {
        borderWidth: 0,
      },
      orient: 'vertical',
      backgroundColor: 'rgba(0,67,153,0.06)',
      bottom: 100 - 17 * (data?.length ?? 0),
      borderRadius: 4,
      itemWidth: 10,
      itemHeight: 10,
      padding: [12, 20],
      itemGap: 7,
      icon: 'rect',
      textStyle: {
        padding: [0, 0, 0, 4],
        color: '#111',
        fontWeight: 400,
        fontFamily: 'sans-serif',
        lineHeight: 15,
        fontSize: 12,
      },
    },
    series: [
      {
        itemStyle: {
          borderWidth: 1,
          borderRadius: 0,
          borderColor: '#fff',
        },
        name: '',
        type: 'pie',
        radius: '80%',
        top: -115,
        label: {
          show: false,
          position: 'center',
        },
        data: data,
        labelLine: {
          show: false,
        },
        emphasis: {
          itemStyle: {
            shadowBlur: 10,
            shadowOffsetX: 0,
            shadowColor: 'rgba(0, 0, 0, 0.5)',
          },
        },
      },
    ],
  };
  return (
    <div>
      <ReactECharts
        ref={ref}
        option={options}
        style={{ width: 250, height: 400, margin: '25px auto' }}
        opts={{ renderer: 'svg' }}
      />
    </div>
  );
});
3. 在最外层父级,写一些方法,进行联动操作。
handleClickPie 方法是当我们点击左侧列表时,对应部分的右边饼图高亮显示,点击当前项,同时要取消上一次点击项的高亮。那么此时,我们就要拿到,之前高亮的项的index(prePieRef)和当前的高亮的项的index(currentIndex)。
clickOutsidePieRef:点击屏幕其他位置时,取消当前高亮
注意📢:这个ref必须给饼图的外层容器,否则不能生效!
import { Box, Group } from '@mantine/core';
import * as React from 'react';
import { useRef, useState } from 'react';
import { Pie } from './Pie';
import StageLine from './StageLine';
import './style.css';
import ReactECharts from 'echarts-for-react';
import { useClickOutside } from '@mantine/hooks';
export default function App() {
  const pieRef = useRef<ReactECharts>(null);
  const prePieRef = useRef(-1);
  const [currentIndex, setCurrentIndex] = useState(-1);
  const handleClickPie = (index: number) => {
    if (prePieRef.current >= 0) {
      pieRef?.current?.getEchartsInstance()?.dispatchAction({
        type: 'downplay',
        seriesIndex: 0,
        dataIndex: prePieRef.current,
      });
    }
    pieRef?.current?.getEchartsInstance()?.dispatchAction({
      type: 'highlight',
      seriesIndex: 0,
      dataIndex: index,
    });
    prePieRef.current = index;
    pieRef?.current?.getEchartsInstance()?.dispatchAction({
      type: 'showTip',
      seriesIndex: 0,
      dataIndex: index,
    });
  };
  const clickOutsidePieRef = useClickOutside(() => {
    const downplay = pieRef?.current?.getEchartsInstance()?.dispatchAction({
      type: 'downplay',
      seriesIndex: 0,
      dataIndex: currentIndex,
    });
    const hideTip = pieRef?.current?.getEchartsInstance()?.dispatchAction({
      type: 'hideTip',
    });
    return { downplay, hideTip };
  });
  console.log(pieRef)
  return (
    <Group>
      <StageLine
        handleClickPie={handleClickPie}
        setCurrentIndex={setCurrentIndex}
      />
      <Box ref={clickOutsidePieRef}>
        <Pie ref={pieRef} />
      </Box>
    </Group>
  );
}最后附上源码:https://stackblitz.com/edit/react-ts-reghex?file=App.tsx,Pie.tsx,StageItem.tsx,StageLine.tsx
到此这篇关于Echarts实现点击列表联动饼图的示例代码的文章就介绍到这了,更多相关Echarts列表联动饼图内容请搜索阿兔在线工具以前的文章或继续浏览下面的相关文章希望大家以后多多支持阿兔在线工具!


