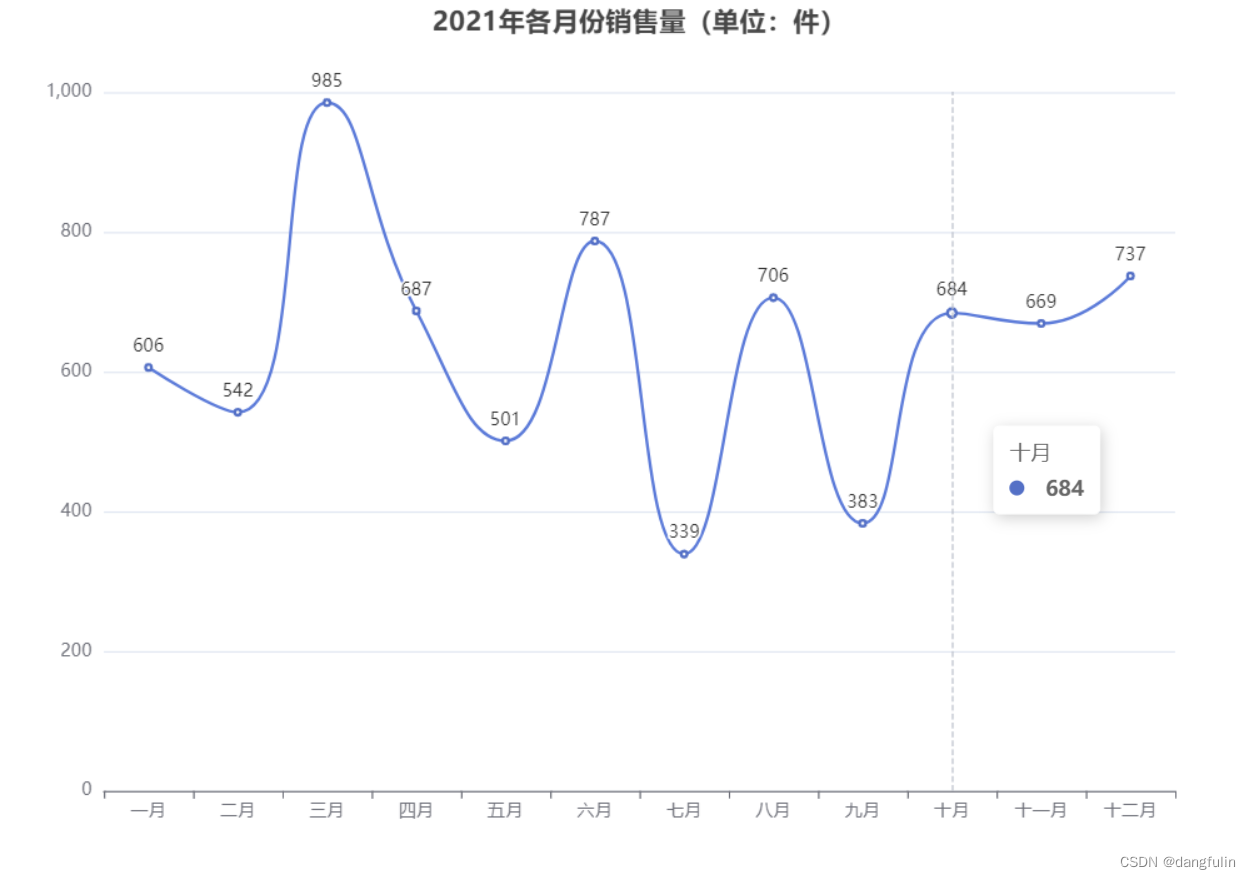
本文实例为大家分享了vue+echarts实现多条折线图的具体代码,供大家参考,具体内容如下
数据未使用json格式,直接写在页面
大致效果

页面代码:
<template>
    <!--为echarts准备一个具备大小的容器dom-->
    <div id="main" style="width: 100%;height: 300px;"></div>
</template>
<script>
    import echarts from 'echarts'
    export default {
        name: '',
        data() {
            return {
                charts: '',
      /*    opinion: ["1", "3", "3", "4", "5"],*/
        xdata:["1/16","1/17","1/18","1/19","1/20","1/21","1/22","1/23","1/24","1/25","1/26","1/27","1/28","1/29","1/30","1/31","2/1","2/2","2/3","2/4","2/5","2/6","2/7","2/8","2/9","2/10","2/11","2/12","2/13","2/14","2/15","2/16","2/17","2/18","2/19","2/20","2/21","2/22","2/23","2/24","2/25","2/26","2/27","2/28","2/29","3/1","3/2","3/3","3/4","3/5","3/6","3/7","3/8","3/9","3/10","3/11","3/12","3/13","3/14","3/15","3/16","3/17","3/18","3/19","3/20","3/21","3/22","3/23","3/24","3/25","3/26","3/27","3/28","3/29","3/30","3/31","4/1","4/2","4/3","4/4","4/5","4/6","4/7","4/8","4/9","4/10","4/11","4/12","4/13","4/14","4/15","4/16","4/17","4/18","4/19","4/20","4/21","4/22","4/23","4/24","4/25","4/26","4/27","4/28","4/29","4/30","5/1","5/2","5/3","5/4","5/5"],
        adata: [0,0,0,0,291,440,571,830,1287,1975,2744,4515,5974,7710,9689,11790,14376,17203,20437,24324,28018,31147,34542,37109,40158,42638,44653,58761,63851,66491,68500,70550,72436,74185,75002,75891,76288,76741,77150,77658,78064,78497,78824,79251,79824     ,80026     ,80151     ,80270     ,80409     ,80552     ,80651     ,80695     ,80735     ,80754     ,80778     ,80793     ,80813     ,80824     ,80844     ,80860     ,80881 ,80894,80928,80967,81008,81054,81093,81171,81218,81285,81340,81394,81439,81470,81518,81554 ,81589,81620,81639,81669,81708,81740,81802 ,81865,81907     ,81953     ,82052     ,82160,82249,82295,82341,82692,82719,82735,82747,82758,82788,82798,82804,82816,82827,82830,82836,82858,82862,82874,82875,82877,82880,82881,82883 ],
        bdata: [0,0,0,0,0,9 ,17 ,25 ,41 ,56 ,80 ,106 ,132 ,170 ,213 ,259 ,304 ,361 ,425 ,490 ,563 ,636 ,722 ,811 ,908 ,1016 ,1113 ,1259 ,1380 ,1523 ,1665 ,1770 ,1868 ,2004 ,2118 ,2236 ,2345 ,2442 ,2592 ,2663 ,2715 ,2744 ,2788 ,2835 ,2870 ,2912 ,2943 ,2981 ,3012 ,3042 ,3070 ,3097 ,3119 ,3136 ,3158 ,3169 ,3176 ,3189 ,3199 ,3213 ,3226 ,3237 ,3245 ,3248 ,3255 ,3261 ,3270 ,3277 ,3281 ,3287 ,3292 ,3295 ,3300 ,3304 ,3305 ,3312 ,3318 ,3322 ,3326 ,3329 ,3331 ,3331 ,3333 ,3335 ,3336 ,3339 ,3339 ,3341 ,3341 ,3342 ,3342 ,4632 ,4632 ,4632 ,4632 ,4632 ,4632 ,4632 ,4632 ,4632 ,4632 ,4633 ,4633 ,4633 ,4633 ,4633 ,4633 ,4633 ,4633 ,4633 ,4633 ],
        cdata: [0,0,0,0,0,0,28 ,34 ,38 ,49 ,51 ,60 ,103 ,124 ,171 ,243 ,328 ,475 ,630 ,892 ,1153 ,1540 ,2049 ,2649 ,3280 ,3996 ,4740 ,5642 ,6723 ,8096 ,9419 ,10851 ,12552 ,14376 ,16157 ,18266 ,20658 ,22888 ,24734 ,27323 ,29745 ,32495 ,36117 ,39002 ,41625 ,44462 ,47204 ,49856 ,52045 ,53726 ,55404 ,57065 ,58600 ,59897 ,61475 ,62793 ,64111 ,65541 ,66911 ,67749 ,68679 ,69601 ,70420 ,71150 ,71740 ,72244 ,72703 ,73159 ,73650 ,74051 ,74588 ,74971 ,75448 ,75770 ,76052 ,76238 ,76408 ,76571 ,76751 ,76964 ,77078 ,77167 ,77279 ,77370 ,77455 ,77525 ,77575 ,77663 ,77738 ,77816 ,77892 ,76979 ,77029 ,77062 ,77084 ,77123 ,77151 ,77207 ,77257 ,77346 ,77394 ,77474 ,77555 ,77578 ,77610 ,77642 ,77685 ,77713 ,77766 ,77853 ,77911 ]
            }
    },

        methods: {
            drawLine(id) {
                this.charts = echarts.init(document.getElementById(id))
                this.charts.setOption({
          title: {
            text: '中国疫情统计'
          },
                    tooltip: {
                        trigger: 'axis'
                    },
                    legend: {
                        data: ['累计确诊','累计死亡','累计治愈']//图例
                    },
                    grid: {
                        left: '3%',
                        right: '4%',
                        bottom: '3%',
                        containLabel: true
                    },

                    toolbox: {
                        feature: {
                            saveAsImage: {}
                        }
                    },
                    xAxis: {//横坐标
                         name: "日期",
                        type: 'category',
                        boundaryGap: false,
                          data: this.xdata

                    },
                    yAxis: {
                         name: "数量",
                        type: 'value'
                    },
                    //三条折线就有三种series,可以更改type以改变是否为折线
                    series: [{
                        name: '累计确诊',
                        type: 'line',
                        data: this.adata,
                    },{
                        name: '累计死亡',
                        type: 'line',
                        data: this.bdata
                    },{
                        name: '累计治愈',
                        type: 'line',
                        data: this.cdata
                    }]
                })
            }
        },
        //调用
        mounted() {
            this.$nextTick(function() {
                this.drawLine('main')
            })
        }
    }
</script>
<style scoped>
    * {
        margin: 0;
        padding: 0;
        list-style: none;
    }
</style>
以上就是本文的全部内容,希望对大家的学习有所帮助,也希望大家多多支持阿兔在线工具。


