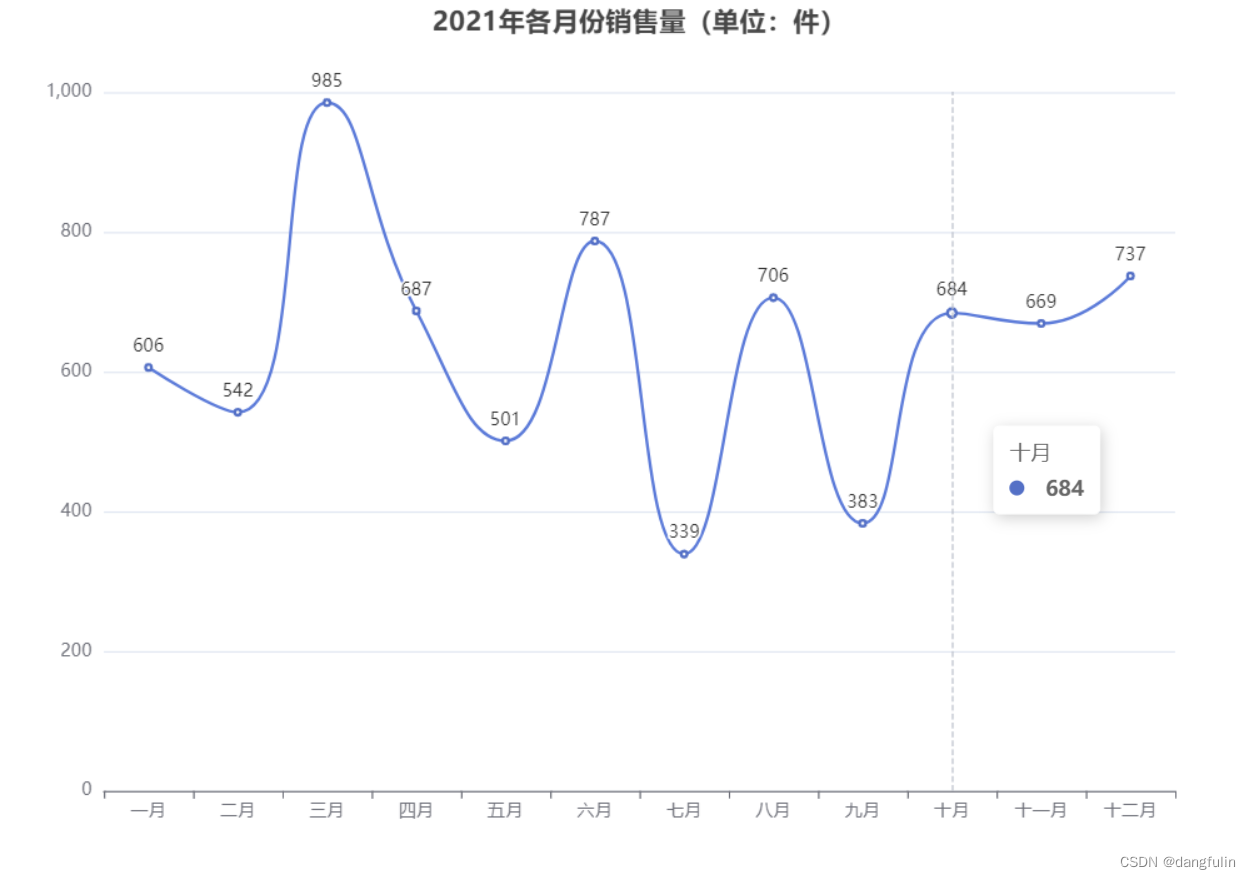
本文实例为大家分享了vue使用echarts实现折线图的具体代码,供大家参考,具体内容如下
效果图:

代码:
<template>
            <div class="proCharts" ref='charts'>
            </div>
</template>

<script>
import echarts from 'echarts'   //npm install echarts@4.9.0
export default {
    data () {
        return {
            option:{
                    color:['rgb(8,252,7)','rgb(255,168,0)',],
                    title: {
                        text: ''
                    },
                    tooltip: { //提示框
                        trigger: 'axis',
                    },
                    legend: {//图例的类型
                        icon:'roundRect',//图例icon图标
                        data: [
                            {
                                name:"上年",
                                textStyle: {
                                    color: '#fff'
                                }

                            },{
                                name:"本年",
                                textStyle: {
                                    color: '#fff'
                                }
                            },
                        ],

                    },
                    grid: {
                        left: '3%',
                        right: '4%',
                        bottom: '3%',
                        top:'17%',
                        containLabel: true //grid区域是否包含坐标轴的刻度标签
                    },
                    xAxis: {
                        type: 'category', //坐标轴类型。
                        boundaryGap: false, //坐标轴两边留白策略
                        data: ['1月', '2月', '3月', '4月', '5月', '6月', '7月','8月','9月','10月','11月','12月'],
                        axisLabel: {//坐标轴刻度标签的相关设置
                            interval:0,
                            textStyle: {
                            color: '#fff',
                            fontSize :10
                            },
                        },
                        axisLine:{//坐标轴轴线相关设置
                            show :true,
                            lineStyle:{
                                color:'rgb(2,121,253)'
                            }
                        },
                        axisTick:{ //坐标轴刻度相关设置。
                            show :false,
                        }
                    },
                    yAxis: {
                        type: 'value',
                        axisLabel: { //x轴的坐标文字
                            show: true,
                            textStyle: {
                                color: '#fff' //文字的颜色
                            },

                        },
                        max:100,//最大值100
                        axisLine:{//坐标轴轴线相关设置
                            show :true,
                            lineStyle:{
                                color:'rgb(2,121,253)'
                            }
                        },
                        axisTick:{ //坐标轴刻度相关设置。
                            show :false,
                        },
                        splitLine:{  //坐标在grid区域的分割线
                          lineStyle: { //设置分割线的样式(图表横线颜色)
                                color: ['#153a8a']
                            }
                        }
                    },
                    series: [
                        {
                            name: '上年',
                            type: 'line',
                            data: [10,20,30,50,50,10,50,60,10,50,10,30],
                            lineStyle:{
                                color:'rgb(8,252,7)'  //线的颜色
                            }
                        },
                        {
                            name: '本年',
                            type: 'line',
                            data: [20,20,30,50,50,10,50,20,30,50,50,30],
                            lineStyle:{
                                color:'rgb(255,168,0)' //线的颜色
                            }
                        }
                    ]
                }
        }
    },
    created () {

    },
    mounted () {
        this.mycharts()
    },
    methods: {
        mycharts(){
            let myChart =echarts.init(this.$refs.charts,"macarons");
            myChart.setOption(this.option)
            //图表自适应
            window.addEventListener("resize",function(){
                myChart.resize()  // myChart 是实例对象
            })
        }
    }
}
</script>

<style scoped>
.proCharts{
    width: 100%;
    height: 400px;
    background: rgb(14, 51, 129);
}
</style>
以上就是本文的全部内容,希望对大家的学习有所帮助,也希望大家多多支持阿兔在线工具。


