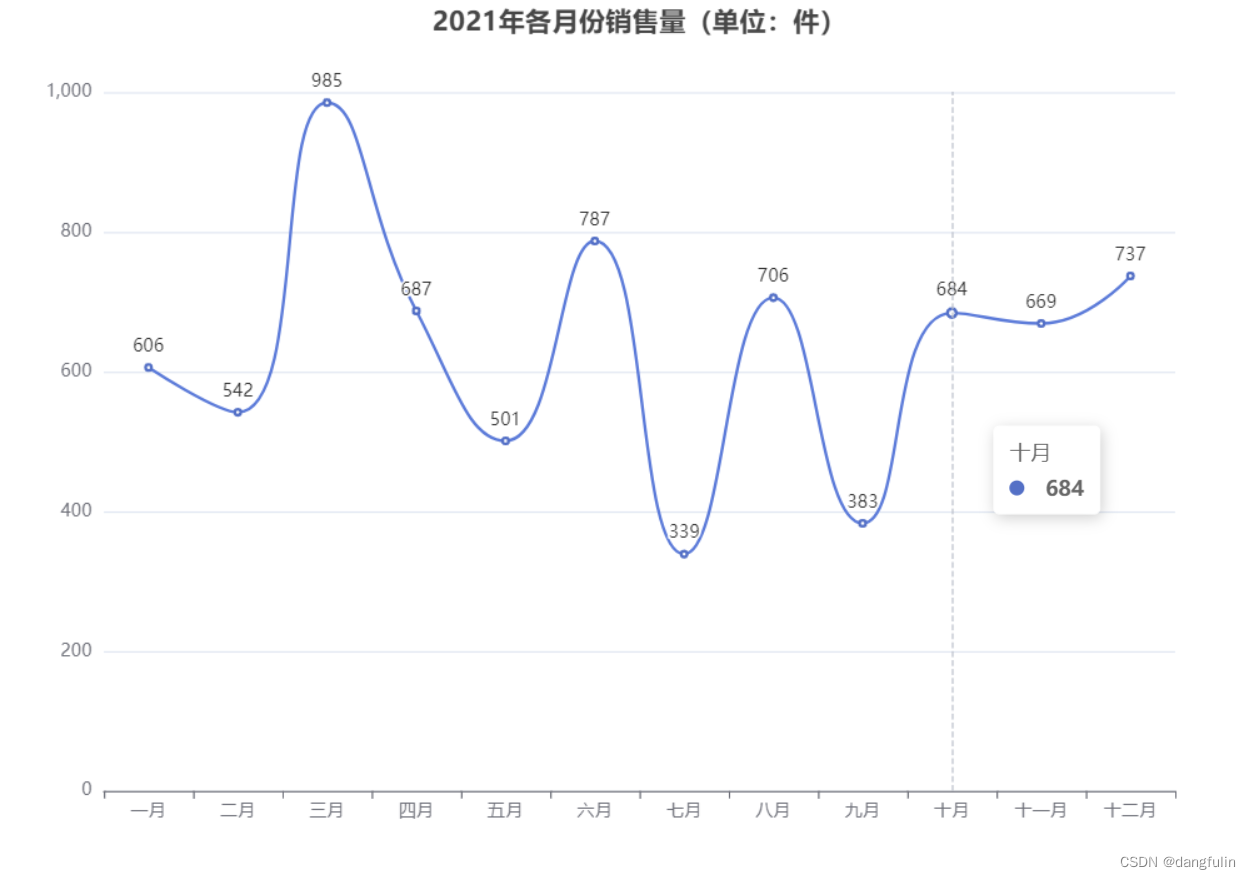
本文实例为大家分享了vue+echarts实带渐变效果折线图的具体代码,供大家参考,具体内容如下

1、安装echarts
npm install echarts --save
2、引入echarts
import echarts from "echarts";
//修改原型链,可在全局使用
Vue.prototype.$echarts = echarts;
3、创建图表 首先需要在 HTML 中创建图表的容器
<div id="echarts_coverage"></div>
// css  图表的容器必须指定宽高
#echarts_coverage{
      width: 400px;
      height: 200px;
}
4、渲染图表
<script>
export default {
  mounted() {
    this.initLineChart();
  },
  methods: {
    initLineChart() {
      let data = [
        {
          dateStr: "2019第1季度",
          numberStr: 10,
        },
        {
          dateStr: "2019第1季度",
          numberStr: 50,
        },
        {
          dateStr: "2019第1季度",
          numberStr: 35,
        },
        {
          dateStr: "2019第1季度",
          numberStr: 92,
        },
        {
          dateStr: "2019第1季度",
          numberStr: 70,
        },
        {
          dateStr: "2019第1季度",
          numberStr: 80,
        },
      ];
      let lineData = {};
      lineData.label = data.map((item) => item.dateStr);
      lineData.data = data.map((item) => item.numberStr);
      let chart = this.$echarts.init(
        document.getElementById("echarts_coverage")
      );
      let option = {
        color: ["#3DB821"],
        tooltip: {
          trigger: "axis",
        },
        grid: {
          left: "3%",
          right: "5%",
          bottom: "8%",
          top: "20%",
          containLabel: true,
        },
        xAxis: {
          type: "category",
          offset: 6,
          axisLine: { lineStyle: { color: " #CCCCCC" } },
          axisTick: {
            show: false,
          },
          axisLabel: {
            interval: 0,
            rotate: 18,
            textStyle: {
              color: "#000",
              fontStyle: "normal",
              fontFamily: "微软雅黑",
              fontSize: 13,
              margin: 10,
            },
          },
          data: lineData.label,
        },
        yAxis: {
          type: "value",
          name: "(%)",
          nameTextStyle: {
            align: "right",
            color: "#4D4D4D",
          },
          axisLine: {
            show: false,
            lineStyle: { color: "#CCCCCC" },
          },
          axisTick: { show: false },
          splitLine: {
            show: true,
            lineStyle: { type: "dashed", color: "#CCCCCC" },
          },
          axisLabel: {
            textStyle: {
              color: "#4D4D4D",
              fontSize: 14,
            },
          },
        },
        series: [
          {
            name: "数量",
            type: "line",
            stack: "总量",
            // symbol: "circle",
            symbolSize: 8,
            minInterval: 6,
            data: lineData.data,
            smooth: false,
            areaStyle: {
              normal: {
                color: {
                  x: 0,
                  y: 0,
                  x2: 0,
                  y2: 1,
                  colorStops: [
                    {
                      offset: 0,
                      color: "#3DB821", // 0% 处的颜色
                    },
                    {
                      offset: 0.5,
                      color: "rgba(51,180,21,.5)", // 100% 处的颜色
                    },
                    {
                      offset: 1,
                      color: "rgba(51,180,21,.1)", // 100% 处的颜色
                    },
                  ],
                  globalCoord: false, // 缺省为 false
                },
              },
            },
          },
        ],
      };
      chart.setOption(option);
    },
  },
};
</script>
以上就是本文的全部内容,希望对大家的学习有所帮助,也希望大家多多支持阿兔在线工具。


