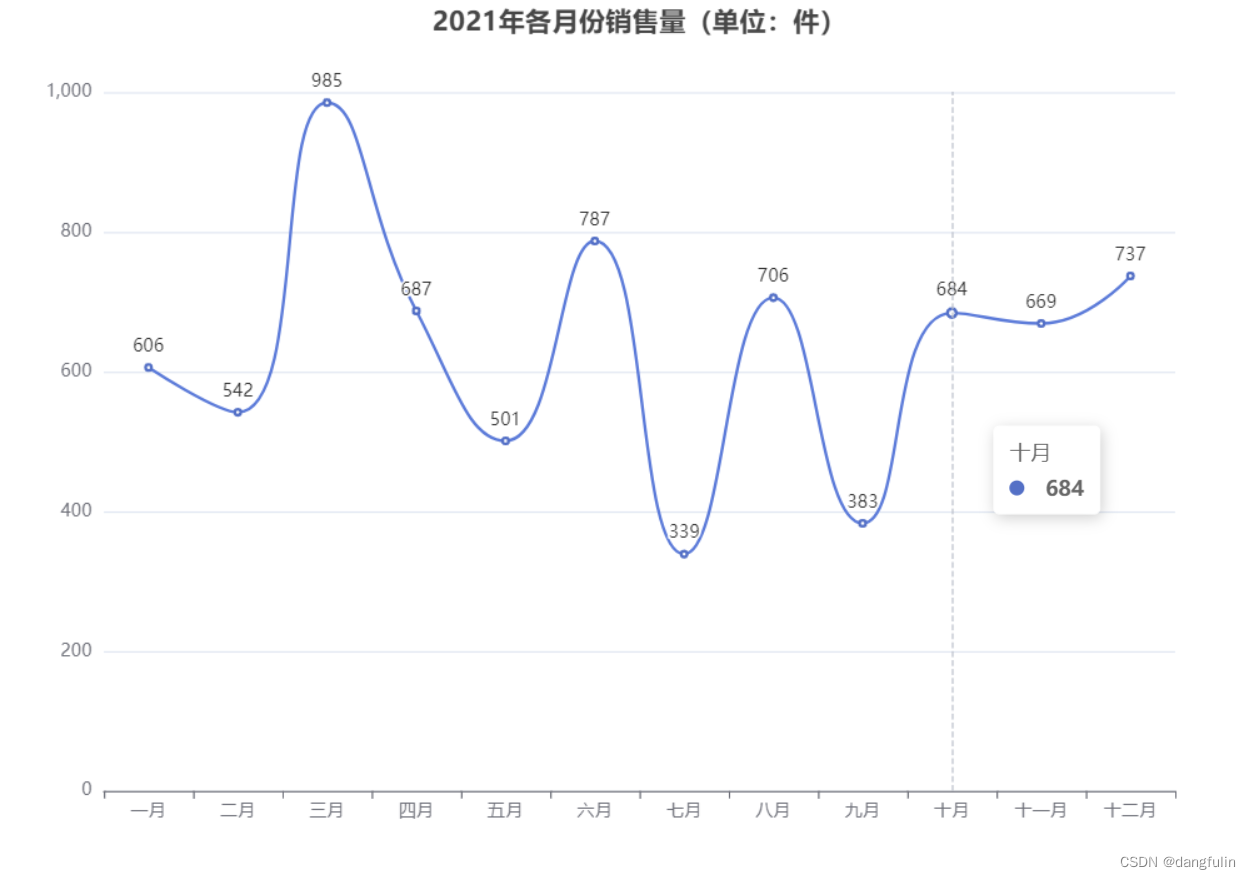
最终效果如图
组件结构设计
外部 Trendpage.vue
<!--针对于/trendpage 这条路径显示 测试显示组件-->
<template>
  <div class="comP1">
    <Trend></Trend>
  </div>
</template>
<script>
  import Trend from "@/components/Trend";
  export default {
    name: "TrendPage",
    components:{Trend}
  }
</script>
<style scoped>
</style>
内部Trend.vue
<!-- 显示地区销量趋势的折线图表 -->
<template>
<div class="comP2" ref="trend_1"></div>
</template>
<script>
export default {
data () {
return {}
},
methods: {}
}
</script>
<style lang="less" scoped>
</style>
初始化图表+数据的获取+更新图表
设置好这些函数 在mounted生命周期内调用
    mounted() {
      // 渲染DOM元素之后 初始化图表实例 请求数据 监听页面尺寸变化
      this.initChart()
       this.getData()  // 请求数据
      // 监听图表尺寸发生变化时的 处理函数   自适应尺寸
      window.addEventListener('resize',this.screenAdapter)
      this.screenAdapter()
    },
找到盒子初始化图表、这里只是简单设置的直角坐标系
      initChart(){
        this.chartInstance = this.$echarts.init(this.$refs.trend_1,this.theme)
        const initOption = {
          grid:{
            left:'3%',
            top:'35%',
            right:'4%',
            bottom:'1%',
            containLabel:true
          },
          tooltip:{ // 鼠标悬浮时的提示框
            trigger:'axis'
          },
          legend:{
            left: 20,
            top: '15%',
            icon:'circle'
          },
          xAxis: {
            type:'category',
            boundaryGap:false // 紧贴两侧边缘
          },
          yAxis:{
            type:'value'
          }
        }
        this.chartInstance.setOption(initOption)
      },
发送请求、获取数据
      getData(){
        const {data:res} = await this.$http.get('trend')
        this.allData = res
        this.updateChart()
      },
请求过来的数据:
{
    "map": {
        "title": "地区销量趋势",
        "base": 310,
        "unit": "万",
        "data": [{
            "name": "上海",
            "data": ["155.13","154.65","171.46","164.38","237.23","300.65","240.29","232.07","193.31","136.70","48.64","90.20"]
        }, {
            "name": "北京",
            "data": ["86.25","33.80","145.58","21.79","176.09","132.41","291.05","191.89","151.54","94.25","141.75","157.14"]
        }, {
            "name": "深圳",
            "data": ["143.94","186.29","183.64","251.48","195.48","152.16","52.47","184.12","203.79","39.16","56.37","161.64"]
        }, {
            "name": "广州",
            "data": ["57.60","77.61","307.24","165.05","175.41","276.88","269.04","296.11","105.31","283.39","134.08","265.38"]
        }, {
            "name": "重庆",
            "data": ["200.82","215.56","249.80","222.67","216.98","60.12","309.68","273.35","150.99","251.97","26.15","186.99"]
        }]
    },
    "seller": {
        "title": "商家销量趋势",
        "base": 120,
        "unit": "万",
        "data": [{
            "name": "商家1",
            "data": ["33.00","86.07","28.77","34.29","102.45","0.30","50.50","21.70","25.41","25.71","66.90","63.29"]
        }, {
            "name": "商家2",
            "data": ["12.83","102.42","37.37","95.55","45.45","112.72","113.53","106.41","75.67","113.91", "37.32", "28.04"]
        }, {
            "name": "商家3",
            "data": ["73.54","40.92","89.81","113.41","76.34","107.15","55.61","0.33","106.29","78.30","98.05","38.67"]
        }, {
            "name": "商家4",
            "data": ["47.19","73.57","44.60","84.03","62.82","15.65","64.72","88.98","29.25","5.41","79.11","118.46"]
        }, {
            "name": "商家5",
            "data": ["74.84","116.45","107.69","11.03","17.31","42.22","97.60","108.64","43.87","110.65","5.96","38.41"]
        }]
    },
    "commodity": {
        "title": "商品销量趋势",
        "base": 50,
        "unit": "万",
        "data": [{
            "name": "女装",
            "data": ["47.71","13.34","19.30","7.93","41.93","23.01","22.63","26.91","0.62","39.23","48.74","29.48"]
        }, {
            "name": "手机数码",
            "data": ["46.66","46.52","23.65","1.73","44.26","47.07","17.86","40.20","3.78","31.46","28.01","8.63"]
        }, {
            "name": "男装",
            "data": ["26.98","30.71","42.59","29.50","26.86","17.65","30.15","15.85","9.28","30.20","32.35","34.46"]
        }, {
            "name": "大家电",
            "data": ["20.26","46.23","43.84","46.75","28.29","32.36","45.30","16.73","40.40","45.07","29.86","41.92"]
        }, {
            "name": "美妆护肤",
            "data": ["7.58","23.66","39.78","30.20","25.72","36.20","47.55","35.39","27.85","37.56","16.91", "3.91"]
        }]
    },
    "common": {
        "month": ["一月", "二月", "三月", "四月", "五月", "六月", "七月", "八月", "九月", "十月", "十一月", "十二月"]
    },
    "type": [{
        "key": "map",
        "text": "地区销量趋势"
    }, {
        "key": "seller",
        "text": "商家销量趋势"
    }, {
        "key": "commodity",
        "text": "商品销量趋势"
    }]
}
数据请求过来后在进行 相应处理 渲染图表
data中预留的变量:
data(){
  return{
    chartInstance:null,// 预留初始化实例对象
    allData:null, // 服务器请求过来的数据
    showChoice:false, // 是否显示可选项
    choiceType:'map', // 显示的数据类型
    titleFontSize:0 // 指明标题的字体
  }
},
1.准备好两个数组 颜色透明度 0.5 ->0.1
2.抽取时间轴的数据
3.抽取组合 series 系列的数组
4.抽取 legend 分类提示
5.重新生成 option 调用 setOption 渲染图表
      updateChart(){
        // 数据更新时 重新渲染
        // 预设半透明颜色的值
        const colorArr1 = [
          'rgba(11,168,44,0.5)',
          'rgba(44,110,255,0.5)',
          'rgba(22,242,217,0.5)',
          'rgba(254,33,30,0.5)',
          'rgba(250,105,0,0.5)'
        ]
        // 预设全透明颜色的值
        const colorArr2 = [
          'rgba(11,168,44,0.1)',
          'rgba(44,110,255,0.1)',
          'rgba(22,242,217,0.1)',
          'rgba(254,33,30,0.1)',
          'rgba(250,105,0,0.1)'
        ]
        // 处理请求过来的 this.allData 数据 直接用变量 导进设置中
        const timeArr = this.allData.common.month // 类目轴的月份
        const valueArr = this.allData[this.choiceType].data // 数值轴的数据
        const seriesArr = valueArr.map((item,index) => {
          return {
            type:'line', // 类型是折线图
            data:item.data, // 数据是每一项的data
            stack:this.choiceType, // 设置成堆叠图一样的字符串就可以
            name:item.name, // 每一项的提示 name
            // 每一项面积颜色的设置 运用到 上面定义的两个数组
            areaStyle:{
              color:new this.$echarts.graphic.LinearGradient(0,0,0,1,[
                {
                  offset:0,
                  color:colorArr1[index]
                },
                {
                  offset:1,
                  color:colorArr2[index]
                }
              ])
            }
          }
        })
        const legendArr = valueArr.map(item => {
          return item.name
        })
        const dataOption = {
          xAxis: {
            data:timeArr
          },
          legend:{
            data:legendArr
          },
          series:seriesArr
        }
        this.chartInstance.setOption(dataOption)
      },
尺寸变化的适配-第三篇文章已经详细讲过
      screenAdapter(){
        // 页面分辨率发生改变时 重新渲染
        this.titleFontSize = this.$refs.trend_1.offsetWidth / 100 * 3.6
        const adapterOption = {
          // legend 是提示类目的文字 可以总的设置 也可以在单独的 series 里设置
          legend: {
            itemWidth: this.titleFontSize,
            itemHeight: this.titleFontSize,
            itemGap: this.titleFontSize,
            textStyle: {
              fontSize: this.titleFontSize / 2
            }
          }
        }
        this.chartInstance.setOption(adapterOption)
        this.chartInstance.resize()
      },
标题显示以及对于数据的切换操作

请求过来的数据当中 有 三种类型 map seller commodity 默认是 map
在template 当中添加 标题选择模块 附加一定的样式 使得标题显示在对应的位置
- 整体的 位置 由title 样式决定 动态样式 comStyle 会随着窗口变化和主题切换而改动
- showTitle 根据this.choiceType 动态决定标题
- icon-font 字体图标 小箭头 点击切换 下拉标题的选择
- v-for 渲染下拉标题 过滤掉当前选择的标题
- 为每一小项 添加点击事件 传入 对应的key 更新this.choiceType 后重新渲染图标 并隐藏下拉
<template>
<div class="comP3">
<div class="title" :style="comStyle">
<span>{{'▎ ' + showTitle}}</span>
<span class="iconfont title-icon" :style="comStyle" @click="showChoice = !showChoice"></span>
<div class="select-con"
:style="theme === 'chalk' ? 'background-color: #222733;' : 'background-color: #ffffff;'"
v-show="showChoice">
<div class="select-item" :style="marginStyle" v-for="item in selectTypes" :key="item.key" @click="handleSelect(item.key)">
{{item.text}}
</div>
</div>
</div>
<div class="comP2" ref="trend_1"></div>
</div>
</template>
<style scoped lang="less">
.title {
position: absolute;
left: 20px;
top: 20px;
z-index: 10;
cursor: pointer;
user-select: none;
color: white;
.title-icon {
margin-left: 10px;
}
.select-con {
/*background-color: #222733;*/
}
}
</style>与之对应的计算属性和方法:
    computed:{
      ...mapState(['theme']),
      // 准备遍历选项的 元数据
      selectTypes(){
        if (!this.allData){
          return []
        }else {
          return this.allData.type.filter(item =>{
            return item.key !== this.choiceType
          })
        }
      },
      // 显示当前选中的标题
      showTitle(){
        if(!this.allData){
          return ''
        }else {
          return this.allData[this.choiceType].title
        }
      },
      // 设置给标题的样式
      comStyle(){
        return `font-size:${this.titleFontSize}px;color:${getThemeValue(this.theme).titleColor}`
      },
      marginStyle(){
        return `padding-left:${this.titleFontSize}px`
      },
    },
methods:{
      handleSelect(currentType){
        this.choiceType = currentType
        this.updateChart()
        this.showChoice = false
      }
}
到此这篇关于Vue echarts实例项目地区销量趋势堆叠折线图实现详解的文章就介绍到这了,更多相关Vue echarts堆叠折线图内容请搜索阿兔在线工具以前的文章或继续浏览下面的相关文章希望大家以后多多支持阿兔在线工具!


